Not all backtests are accurate. The only sure way of knowing whether a backtest is done correctly is to do it yourself and compare. Unfortunately, this is usually not possible and not many people know how to backtest Forex robots correctly. When you run repeat the backtest of any EA and do it correctly it becomes easy to know if any given backtest is fabricated or not. When investigating backtest report a special attention should be paid to the type of Spread, modeling quality, modeling type, and the graph.
This article was written to help you tell differences between fabricated and genuine backtesting results.
What is an Expert Advisor backtest result?
Backtesting functionality allows traders to check how an Expert Advisor (EA) would have traded in the past. This is how it essentially works. A trading strategy is put into an algorithm and in the process, an expert advisor is created.
The expert advisor (in a lay man’s term) may be assumed to be the ultimate trading robot for the trader, which monitors markets all day long and carries out a series of trading for the user. Once it has been created, the EA can be used to run tests on previous data prices, for instance, from 2000 to 2017. This is referred to as Backtest. The results displayed would likely represent the outcome of the strategy had it been used at the designated time frame.
It should be noted however that the strategy in question would not continually work the way it works in the backtest result. The lagged data is, therefore, a poor estimator of the future due to the volatility of the market – forces affecting the data in the past may change or be absent
For the trading strategy to be effective it has to be carried out over a long period of time. A test run of a few days or months will not yield the right results if the trading strategy is to be used in future estimations.
Discrepancies may occur when the strategist or trader has no experience in backtesting. He/she may make mistakes unintentionally and therefore get incorrect results. However, there are malicious people with the knowledge of the weaknesses of backtesting engines. They therefore manipulate backtests to trick people into adopting strategies that are incorrect. The good news is there is Myfxbook, which can be used to yield true trading results.

Prior to Myfxbook, backtest (with its inconsistencies) was the only method of testing the potential of trading strategies. Many people, unfortunately, were led astray by fabricated backtests and Meta trading statement reports.
Though not all backtest results are fabricated, it would be safe to use tools that would prove or disprove the viability of forex trading strategies.
Consider the diagram below which comprises of two backtest results:
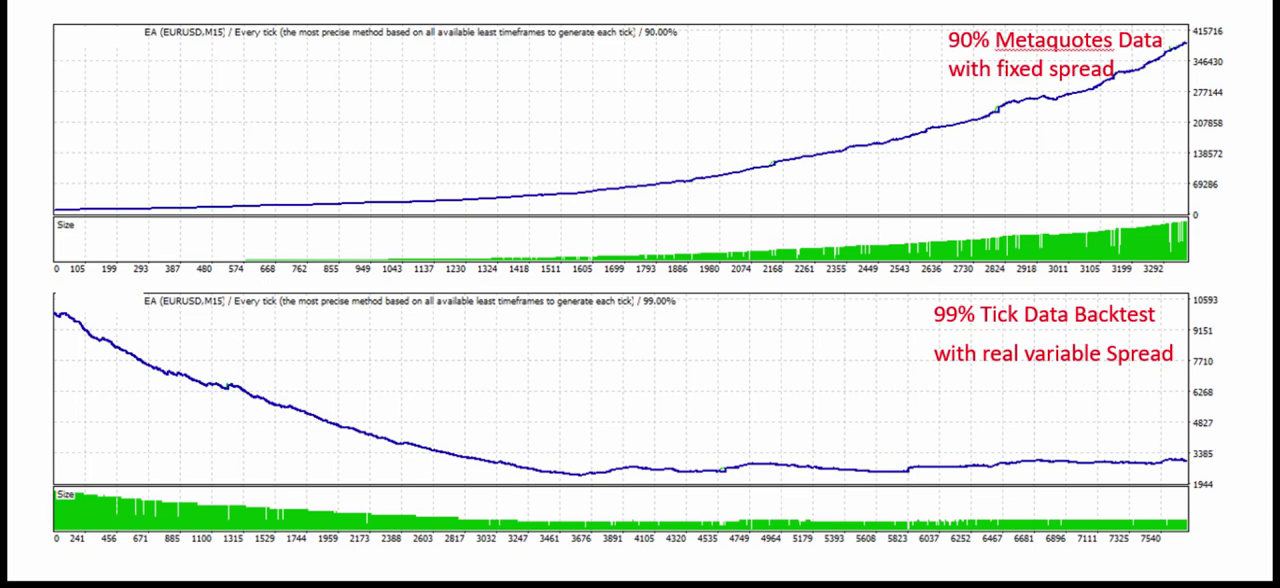
It is clear that the two graphical results are different- the first curve is ascending upwards, while the other one is descending downwards. The truth of the matter is that they both represent the same data: same time period, same EA, same quality model and all parameters are identical. The difference is the first graph is run on a default Metaquotes data, which at its best can only reach 90% modeling quality. It also uses fixed spread, which is inaccurate in the real trading environment because most brokers do not use fixed Spread. They use variable spread, which changes every second due to the high volatility of the Forex market.
The second graph is run on every tick model with a 99% modeling quality. It also uses variable spread which makes it accurate. While the first graph clearly shows that the EA strategy is good and should be adopted, the second graph disproves this fact and shows the strategy is worth nothing. It is therefore paramount to do backtests with zero errors. A slight flaw in the test will make the test inaccurate. A test with a 90% modeling quality with the fixed spread is considered inaccurate by today’s standards and should be avoided. The backtest illustrated by the graphs above has been done severally by experts and they all have come to the same conclusion that the EA strategy is worthless as indicated by the second graph.
So now you know that backtest can be inaccurate or fabricated. Think again when you see a backtest report on some website.
Recommended read: How to tell if a Forex signal is a scam.
Importance of Backtest Results
- Allows the user to see how a particular strategy (EA) would have been working in the past. Though the test may not be accurate in future forecasts, it highlights the effectiveness of strategies based on their past performances. This may allow the user to make an informed decision on whether use a strategy or not. Trading blindly in the forex market without prior knowledge or experience is hazardous to both newbies and experts. To reduce the likelihood of poor decision making, EA backtests keep track and analyze data over a long period of time, giving a clear picture of how various strategies work. So, if a strategy proves to be effective in the past, then there is a high likelihood that it would be effective too in the future.
- Another advantage of back tests is that flaws and issues in a strategy could be reduced and avoided. If a particular strategy has flaws that may lead to unprofitability, then it is best to be avoided. However, if it has few problems, then it can be honed at the back testing stage.
- It allows the user to understand how a particular EA settles on the trades that are likely to be profitable and the right time to place orders. This knowledge is especially important during the actual currency trading process.
- It gives us the reason to continue with strategy (EA) development and gives trust that we are not wasting time. Forex back testing is a time-consuming process. However, it is important to invest enough time to make sure that the forex trading system works the way it is intended to.
It is worth noting that the accuracy and quality alone of a back test strategy does not guarantee future performance. It is therefore advisable not to judge the quality of a strategy by looking at its back test alone. A proven way of knowing whether a backtested strategy has potential to work in the future is by the use of robustness tests. This involves running thousands of tests, using different parameters, skipping certain trades, shuffling trade sequences orders and changing spread for the simulation to get a vivid picture of how the strategy actually behaves. If the strategy can survive most or all robustness tests and not break, then it has potential. However, if it breaks as a result of the robustness tests, then it should be dismissed as it cannot withstand the volatile nature of the forex market.
It is also important to keenly check if back tests are done properly and accurately. It is unfortunate that very few people know how to perform back tests with high precision, including trading agents. This can be attributed to the fact that there are a lot of ways of doing back tests and a lot of small things that need to be done, which can be easily left out during configuration; this results in an inaccurate back test. This may lead to serious financial loss to the user if he/she decides to adopt an inaccurate strategy because it gave out good looking results.
How to Know if a Back Test is Done Properly
I think every Forex trader should know how to tell the difference between fake and genuine backtesting report. This way everyone could avoid Forex scams.
First of all, check backtest ‘type’ and ‘modeling quality’. It should be performed using ‘Every tick’ modeling type with a 99% modeling quality. If a backtest has a 99% match in modeling quality and model type is “Every Tick”, then it is a good a test. An example of a great backtest is illustrated in the diagram below.

Looking at the red highlighted areas, it is evident that there is a 99% in modeling quality and an “Every Tick” modeling type. The upward trend of the graph shows that it is a good strategy. The modeling quality in the report and in the performance graph image should always match. If they do not, then the backtest report is fabricated.
Secondly, check what spread value was used during the test: fixed or variable spread. If modeling quality is anything but 99%, then a fixed spread was used and the backtest is not accurate. Fixed spreads are not used by brokers anymore and are therefore considered inaccurate. It is therefore unlikely that fixed spreads will yield 99% modeling quality. In fact, if the modeling quality is less than 99%, it shows that the spread was fixed and the strategy is therefore inaccurate and should be avoided. In the previous example, the spread value is 30 points or 3.0 pips.
Some backtesting software can report 99.99% modeling quality with a fixed Spread. This is important to note. So usually 99.00% is the only modeling quality you can trust.
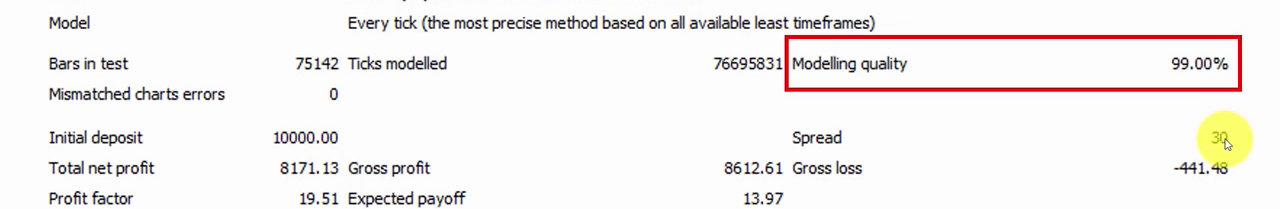
In this case, the spread value is a random value that was generated automatically when the test was run. But it means you can ignore the Spread value of 30 points which has no effect on the backtest. Since the modeling quality is at 99%, it shows that the spread is variable. Confusing, right? All this comes from a variety of computer programs and the lack of a back-testing report standard. So in summary, you better backtest EAs yourself and not trust backtests created by others. However, if modeling quality was at 90% for instance or the model type was different from every tick, then the spread point would be fixed.
The next thing that should be considered is the number of mismatch errors the strategy has. It should be zero. In the example used, the number of mismatch errors is very high. The report shows that even though it may be a good strategy, its test is not very accurate and report cannot be considered. A good strategy backtest report should have zero errors.

Furthermore, the time period and trade amount of the backtest should be put into consideration. The window period of the test should be at least ten years, while the trade count should be around 200. The trade amount is more important due to statistical significance. That is, it is better to have a shorter timeframe with a high number of trades than to have a long period with less number of trades.

Consider this strategy report. Even though the period indicates that there is historical price data from 2003 to 2015, in reality, the report is actually run from 2010 to 2015. This could mean that the owner of the report was hiding something since he/she completely ignored the first seven years. However, this can be accepted as a legit backtest- the modeling type is Every Tick and the quality is at 99%, there is a high number of total trades (1149) and the number of short and long positions won is at 95.21% and 93.50% respectively. This is evident in the graph as it shows an upward trend or growth in income.
Another important thing to check is if the modeling type and quality from the backtest report match with the graph. When the modeling type percentage is different from the modeling quality value, then that is a false and fabricated report. A good example is illustrated in the example below:

How Modeling Quality is Fabricated
A strategy report can be easily fabricated by scammers to dupe unsuspecting clients into believing that a strategy is good when in reality it is not. How do they do it?
First, a command is typed in the address bar in order to make the report editable
javascript: document.body.contentEditable = ‘true’; document.designMode = ‘on’; void 0
Once this command is fed into the address bar, the report becomes editable. For instance, the strategy report below has a 90% modeling quality.

But once it becomes editable, it accepts even the most ambiguous values. For example, I can change the modeling quality to “hello.00%” which is a complete nonsense.

After editing the report, it can be easily converted back to an unedited version simply by typing in the address bar this command:
javascript: document.body.contentEditable = ‘false’; document.designMode = ‘off’; void 0
This shows how backtest reports can be easily altered and by anyone if they chose to. It would not be wise therefore to trust a backtest by simply looking at it. A thorough back check should be done on it before the strategy is accepted as accurate.
Conclusion
Not all backtests are accurate. The only sure way of knowing whether a backtest is done correctly is to do it yourself and compare. Unfortunately, this is usually not possible and not many people know how to backtest Forex robots correctly. So after all, it is best to look at all backtest results with caution.